Monitoring
On this page, we will configure a monitoring system for our Zentyal server using AWS CloudWatch service. Additionally, we will also make use of the AWS SSM Parameter Store service to host the CloudWatch agent configuration on our server and finally, the AWS SNS service for alert notifications.
Warning
Implementing these services will have an additional monthly cost.
SNS
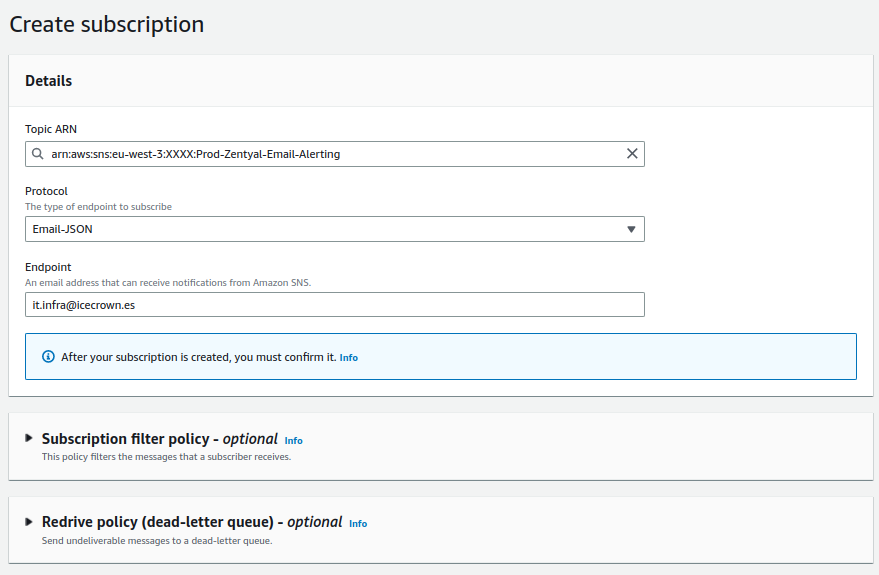
To notify any alerts triggered in CloudWatch, we will use the SNS service, which will send an email to a specified email account. In my case, I will use the created account of it.infra@icecrown.es.
-
Go to
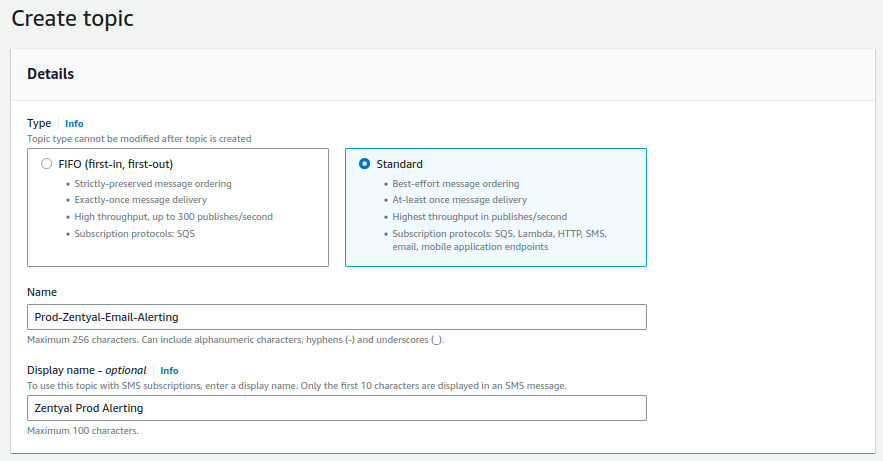
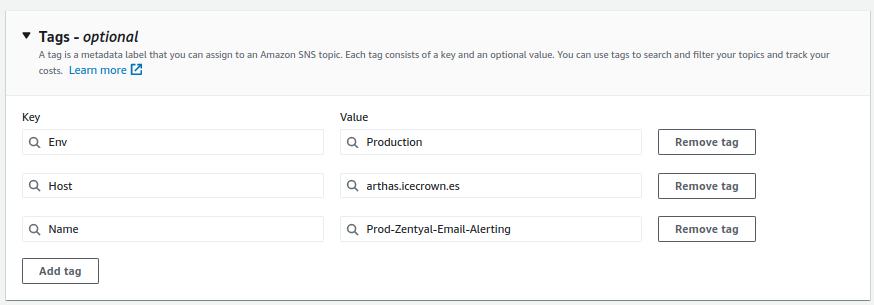
SNSand create a topic calledProd-Zentyal-Email-Alerting: -
Create a
subscriptionfor the email account that will receive the notifications: -
Finally, wait for the email invitation to arrive and activate the subscription.
Note
Since we have the graylist enabled, it may take a few minutes for the invitation to arrive.
SSM Parameter Store
To monitor the resources of the Zentyal server, we will use the AWS CloudWatch service, and we will store its configuration file in the SSM Parameter store.
The configuration I will specify is:
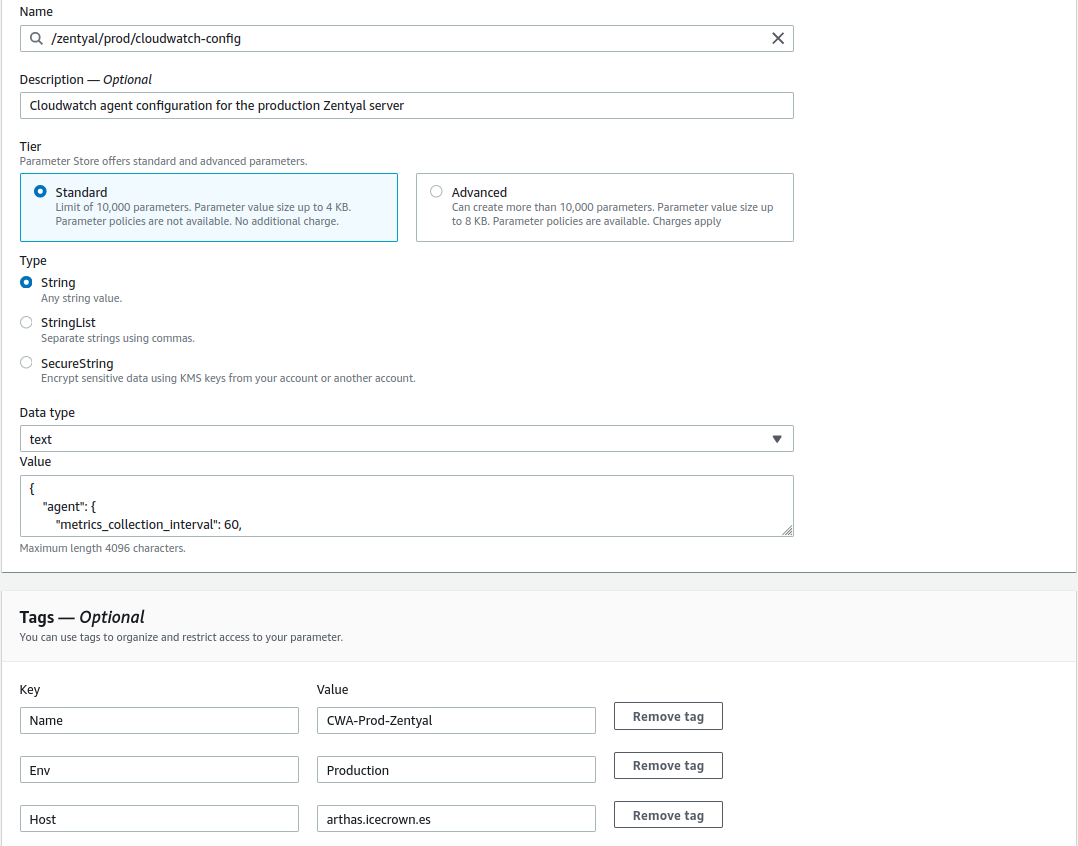
- The complete path to the parameter will be called
/zentyal/prod/cloudwatch-config - The CloudWatch namespace will be called
CWA-Prod-Zentyal. - The metrics interval will be
60seconds. - Additional metrics will be configured for:
- RAM
- Swap
- Disk.
- The 3 EBS volumes will be included in the disk metrics.
- The log
/var/log/zentyal/zentyal.logwill also be monitored, with a retention of 7 days. - The log group in CloudWatch will be called
CWAL-Prod-Zentyal.
Info
For additional configurations or questions, we have the configuration reference here.
The following actions will be taken:
- Go to the region where we have the instance, which in my case is Paris.
- Go to
AWS Systems Manager -> Parameter Store -> Create parameter. -
Create the
parameter: -
Add the agent configuration to the
Valuesection:{ "agent": { "metrics_collection_interval": 60, "run_as_user": "root" }, "metrics": { "namespace": "CWA-Prod-Zentyal", "aggregation_dimensions": [ [ "InstanceId" ] ], "append_dimensions": { "AutoScalingGroupName": "${aws:AutoScalingGroupName}", "ImageId": "${aws:ImageId}", "InstanceId": "${aws:InstanceId}", "InstanceType": "${aws:InstanceType}" }, "metrics_collected": { "mem": { "measurement": [ "used_percent", "used", "free", "total", "cached", "buffered" ], "metrics_collection_interval": 60 }, "swap": { "measurement": [ "used_percent", "used", "free" ], "metrics_collection_interval": 60 }, "disk": { "measurement": [ "used_percent", "used", "free", "total", "inodes_used", "inodes_free", "inodes_total" ], "metrics_collection_interval": 60, "ignore_file_system_types": [ "tmpfs", "vfat", "devtmps" ], "resources": [ "/", "/var/vmail", "/home" ] }, "statsd": { "metrics_aggregation_interval": 60, "metrics_collection_interval": 60, "service_address": ":8125" } } }, "logs": { "logs_collected": { "files": { "collect_list": [ { "file_path": "/var/log/zentyal/zentyal.log", "log_group_name": "CWAL-Prod-Zentyal", "log_stream_name": "{instance_id}", "retention_in_days": 7, "timezone": "UTC" } ] } }, "log_stream_name": "Stream-Prod-Zentyal", "force_flush_interval" : 15 } } -
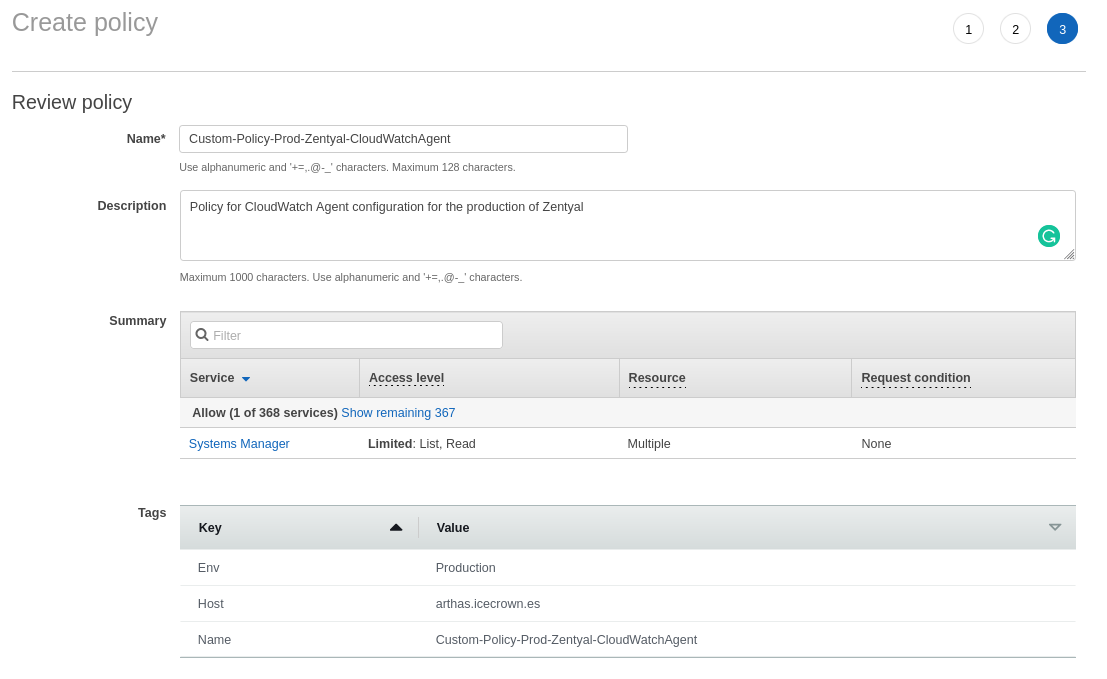
With the parameter created, we will create an IAM policy that allows access from the EC2 instance to the newly created parameter. To do this, go to
IAM -> Policies -
Create a policy that has the following content:
{ "Version": "2012-10-17", "Statement": [ { "Sid": "ParameterStoreZentyal1", "Effect": "Allow", "Action": [ "ssm:GetParameterHistory", "ssm:GetParametersByPath", "ssm:GetParameters", "ssm:GetParameter" ], "Resource": [ "arn:aws:ssm:eu-west-3:*:parameter/zentyal/prod/cloudwatch-config" ] }, { "Sid": "ParameterStoreZentyal2", "Effect": "Allow", "Action": "ssm:DescribeParameters", "Resource": "*" } ] } -
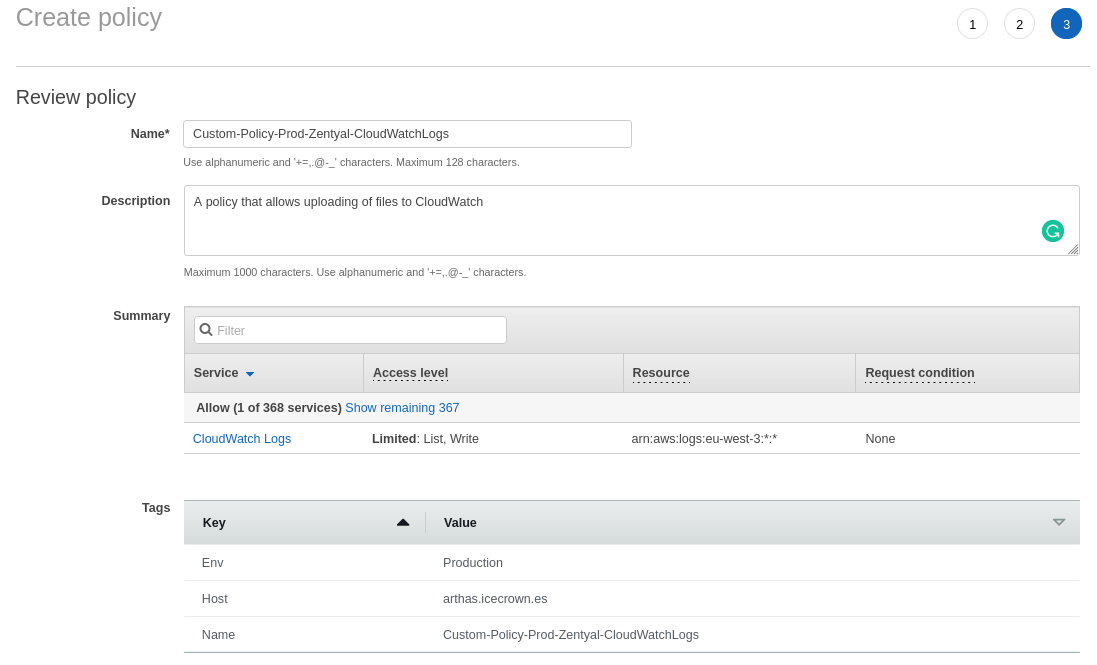
Create another policy that allows uploading the log file to CloudWatch:
-
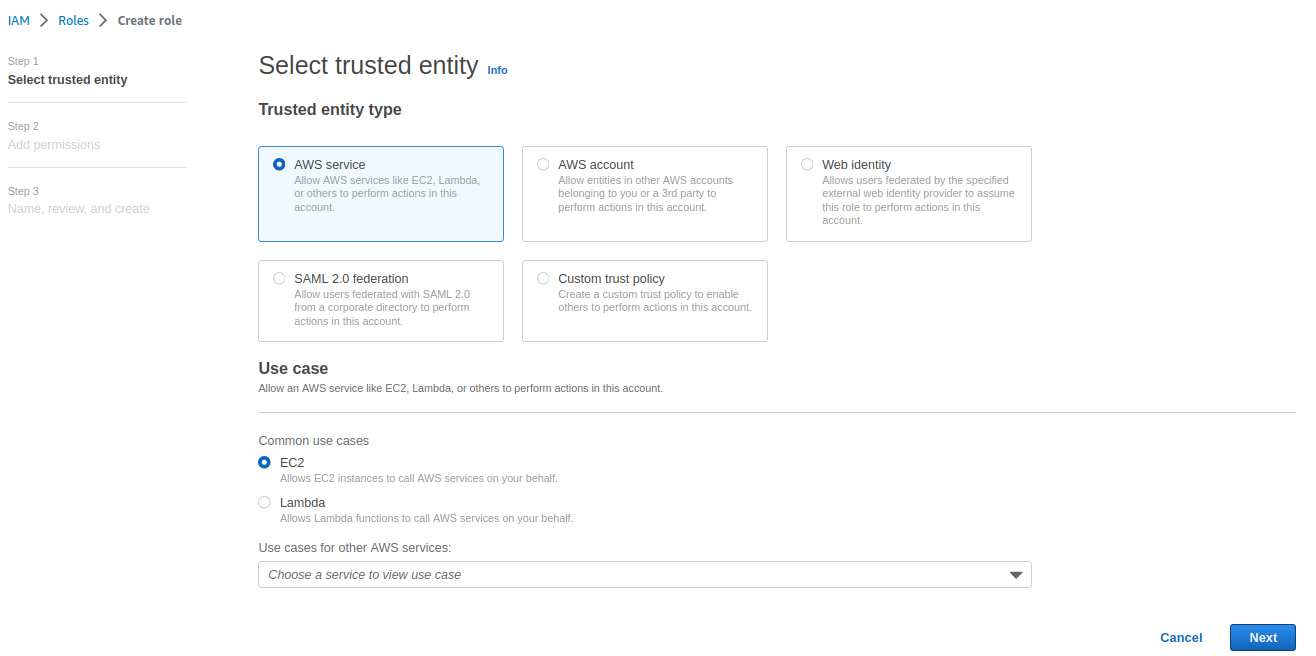
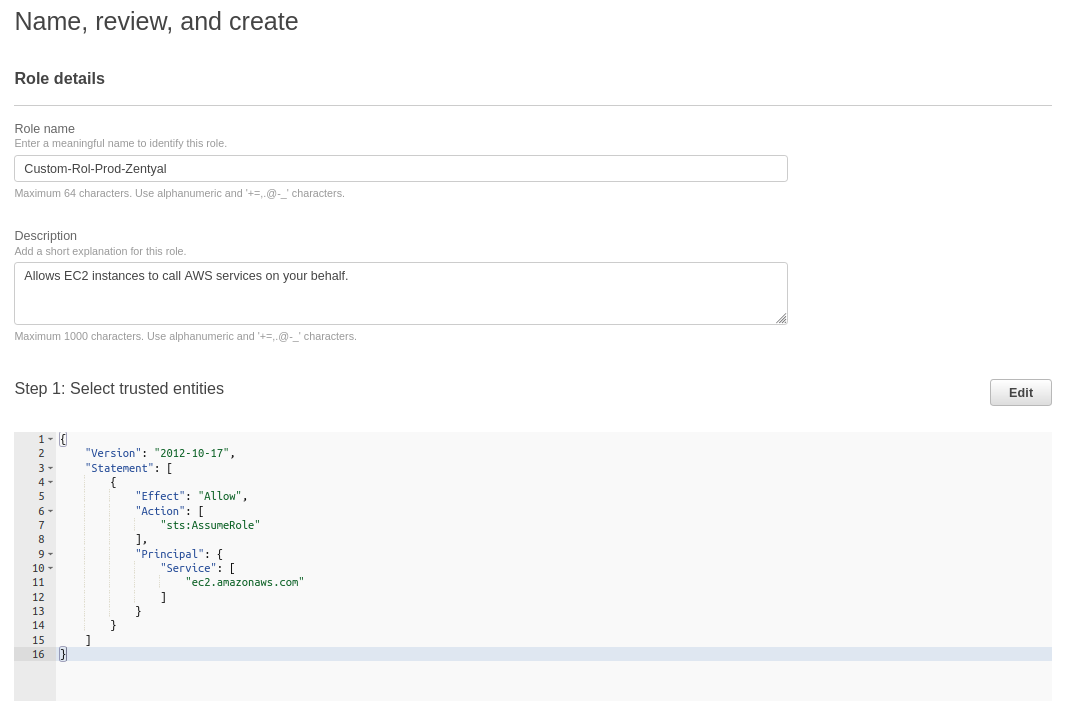
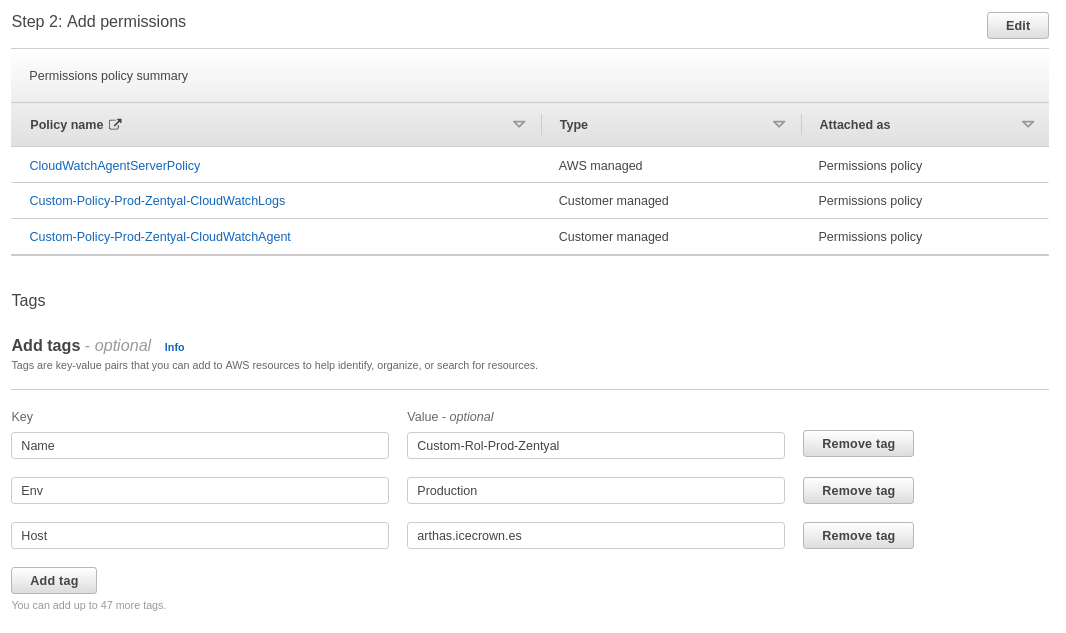
Create a role where we will associate the newly created policies and also the existing one called
CloudWatchAgentServerPolicy. To do this, go toIAM -> Roles: -
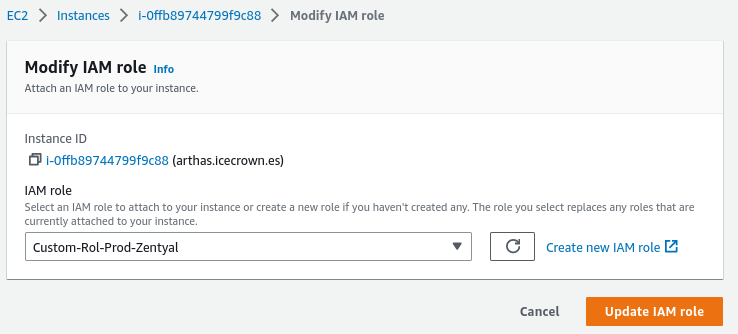
Finally, associate the newly created role with the Zentyal instance. To do this, go to
EC2 -> Actions -> Security -> Modify IAM role:
Cloudwatch
Once we have the AWS environment ready, we will proceed to install and configure the CloudWatch agent to monitor the server and Zentyal's main log file.
-
Download the CloudWatch agent
.debpackage to our Zentyal server: -
Install the package:
-
Descargamos también el archivo comprimido que contiene el binario de AWS para la CLI:
-
Install the unzip package to
unzipthe file: -
Unzip the file and install it:
-
Configure the CloudWatch agent:
-
Confirm that the service is active:
The result I have obtained:
-
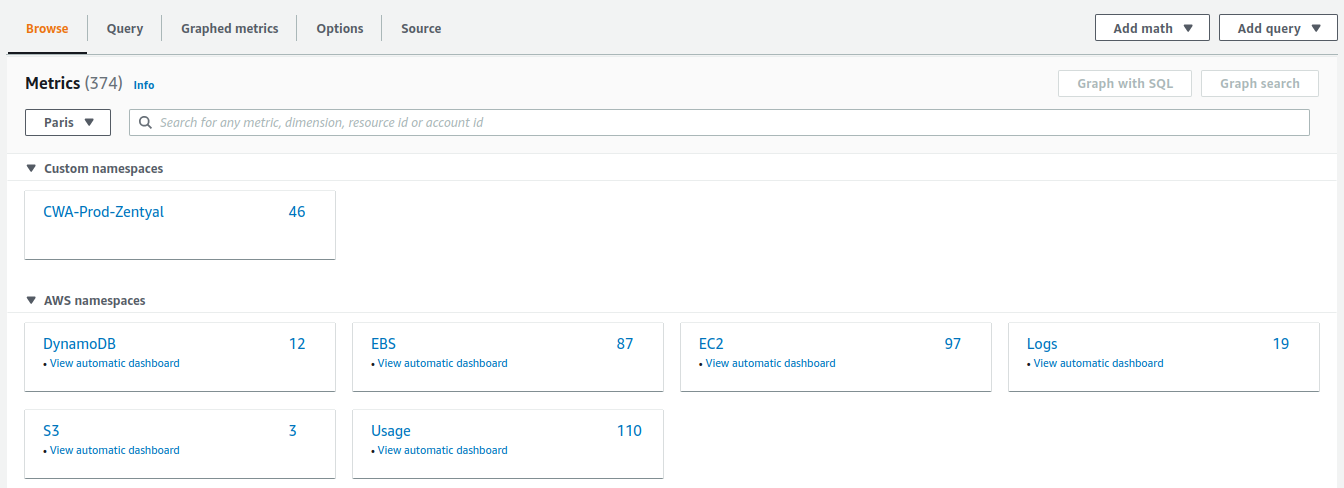
After waiting a couple of minutes, go to
CloudWatch -> All metricsand check that the namespace with custom metrics has been created: -
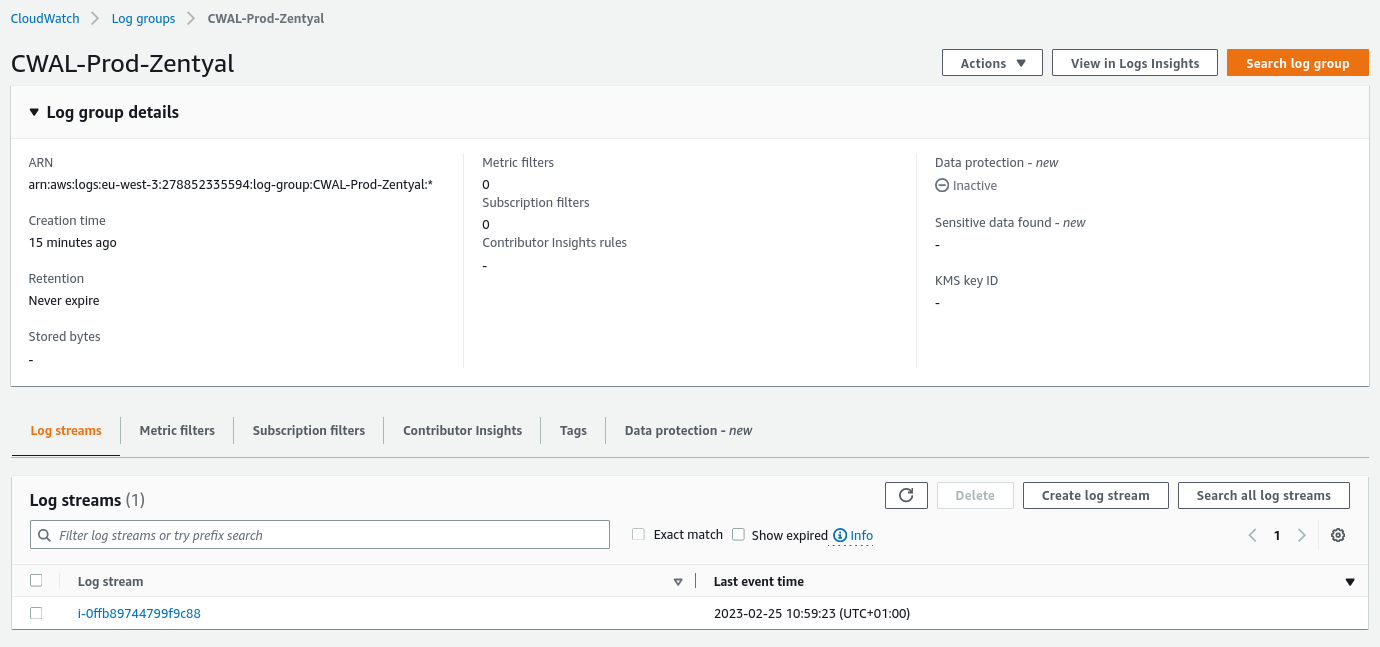
Finally, we also check that the Zentyal log file is being monitored. To do this, we go to
CloudWatch -> Log groups:
Logs
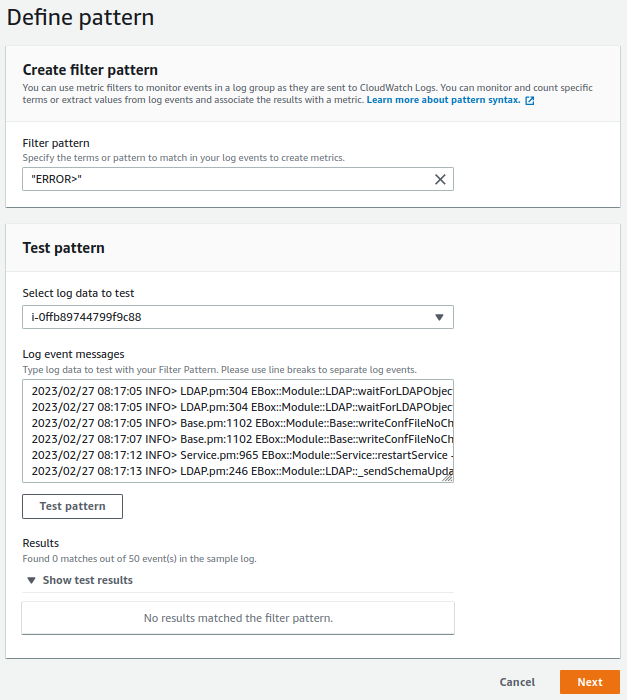
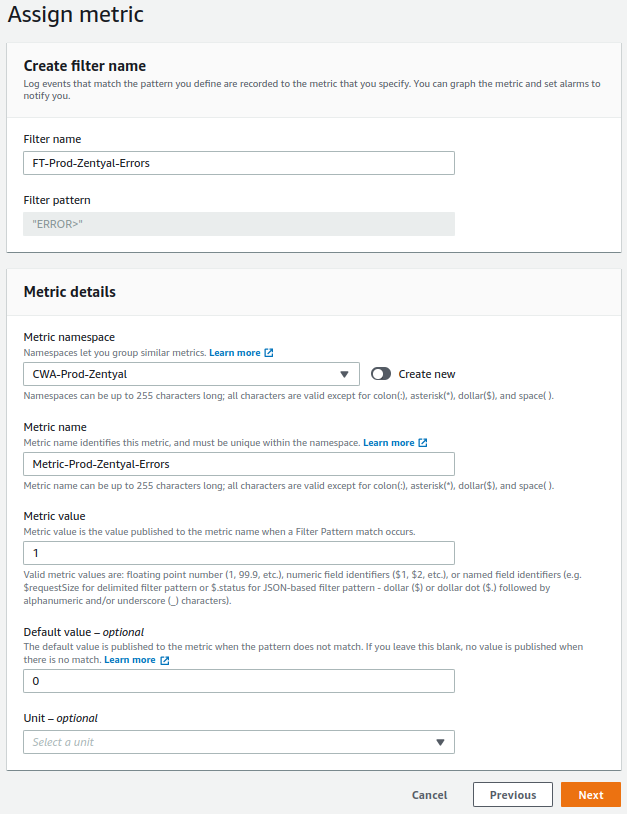
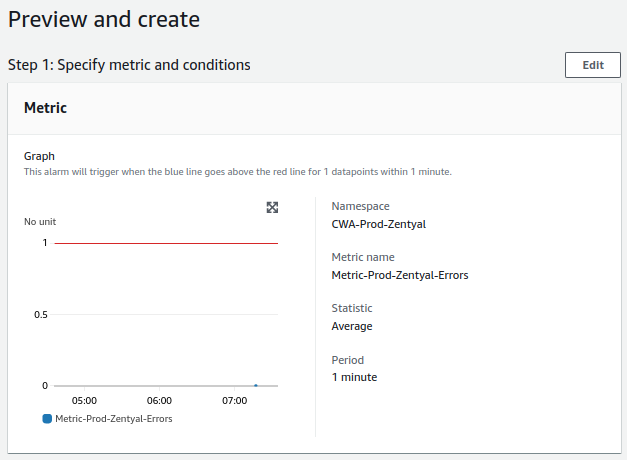
With the main Zentyal file monitored by CloudWatch, we create a metric filter that checks if the log file contains the event ERROR>. The purpose is to create an alert that notifies via email through AWS SNS when this type of event occurs.
-
Go to
CloudWatch -> Metric filtersand create the filter: -
Once the filter is created and a couple of minutes have passed for CloudWatch to collect information.
-
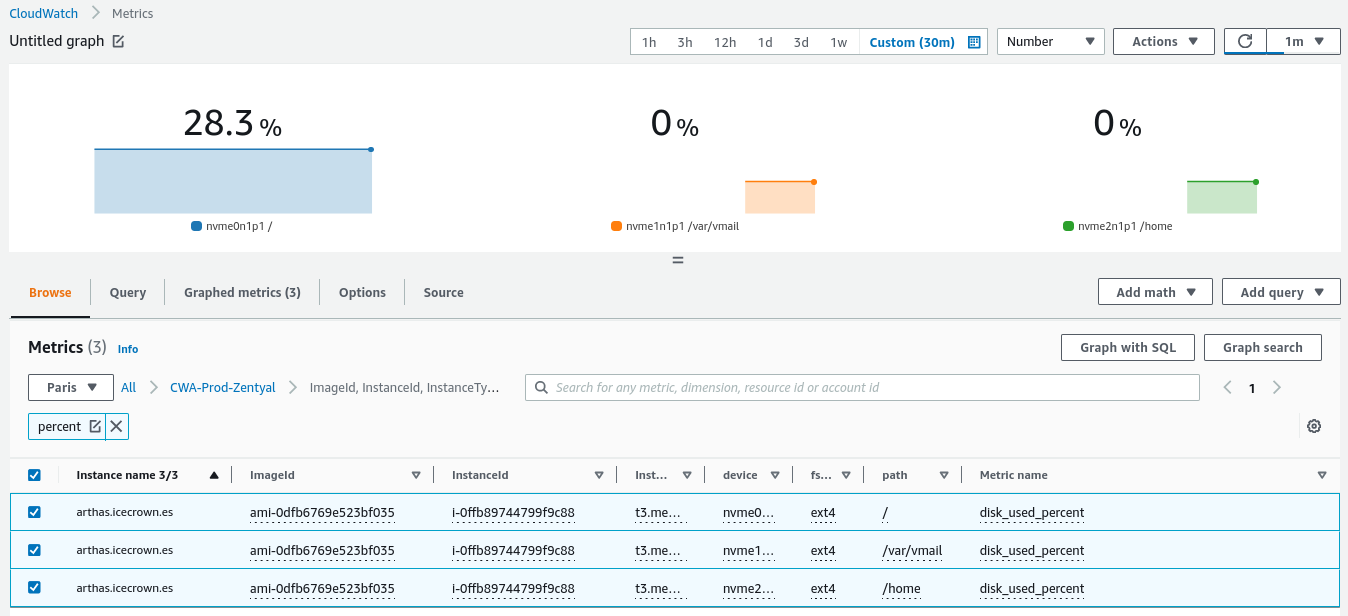
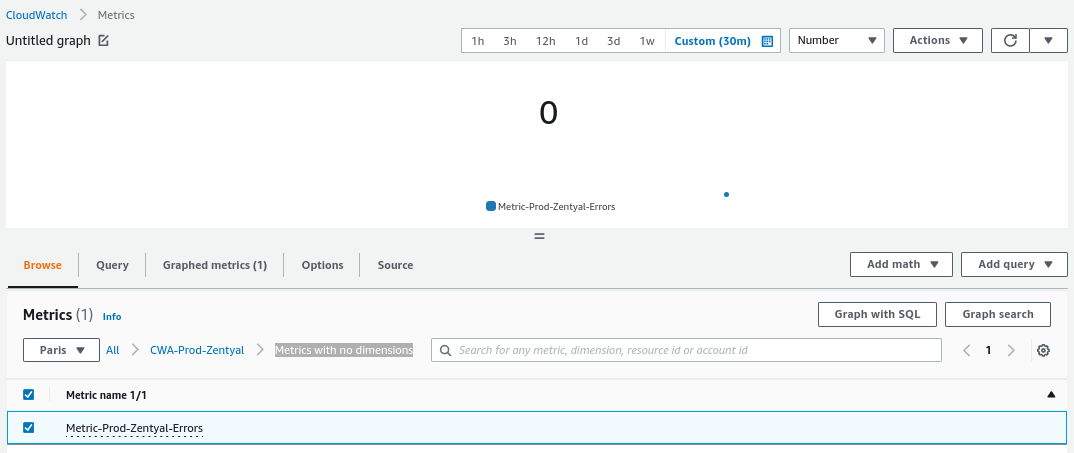
Finally, verify that from
CloudWatch -> All metricswe have the metric available:Note
The type of metric shown in the image is of type
Numberas can be seen at the top.
Dashboard
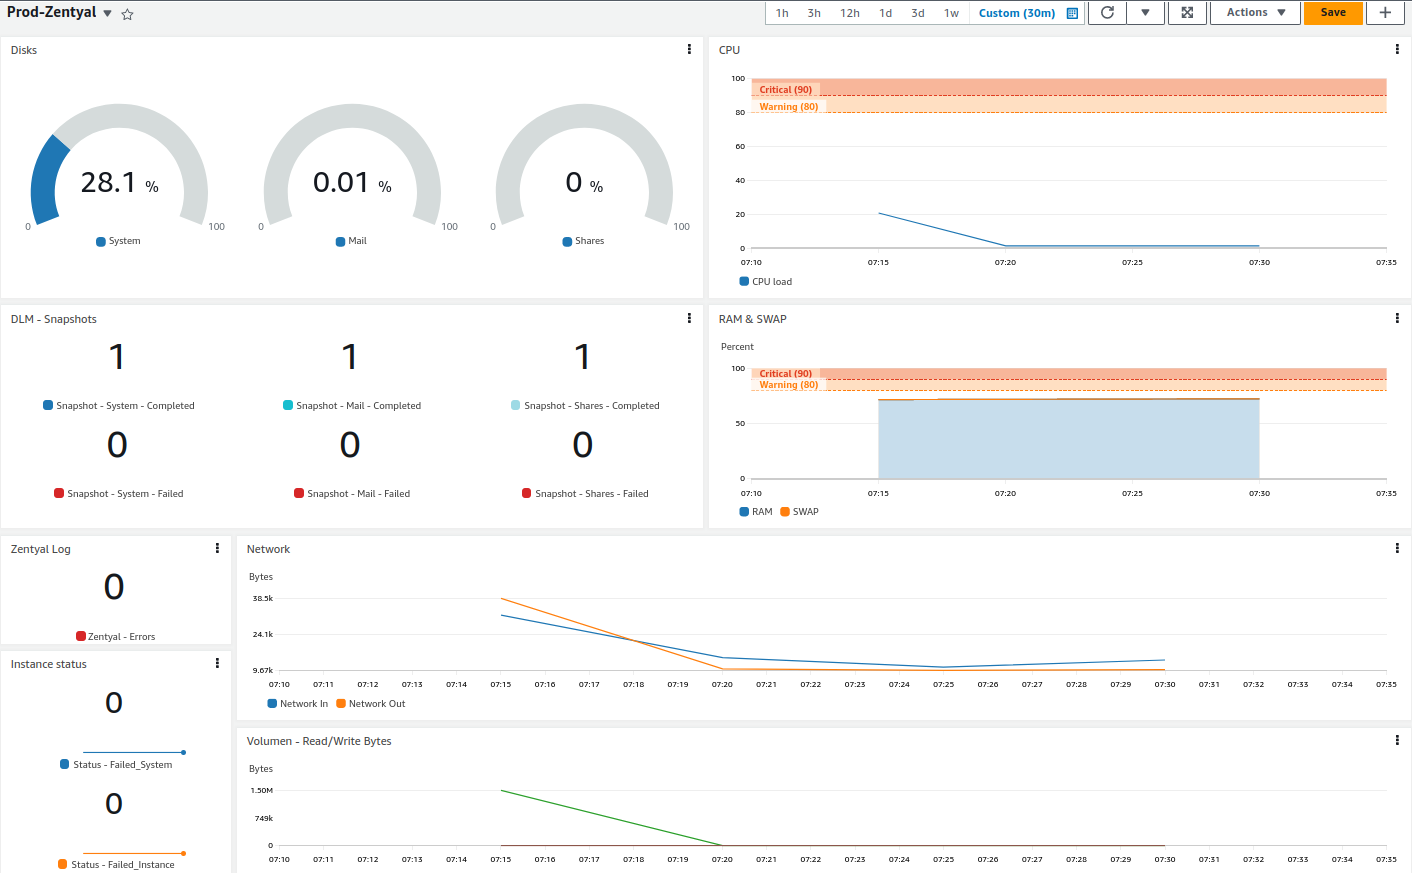
Once the monitoring system is confirmed to be working, we can create a dashboard that groups the most important metrics from CloudWatch -> Dashboard. Here's a simple example:
Alerts
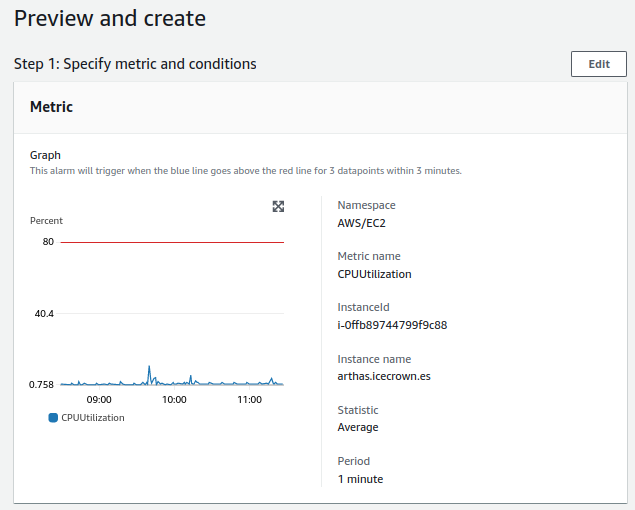
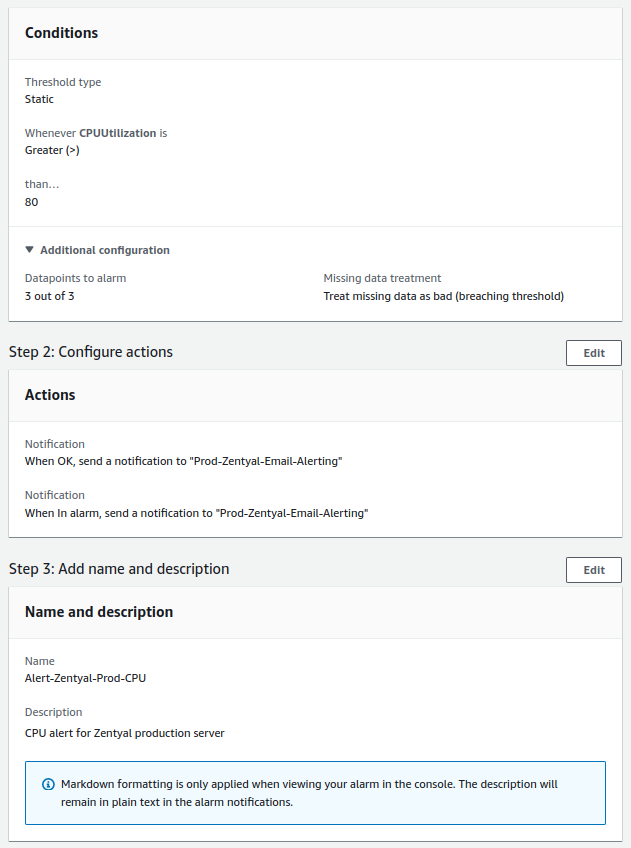
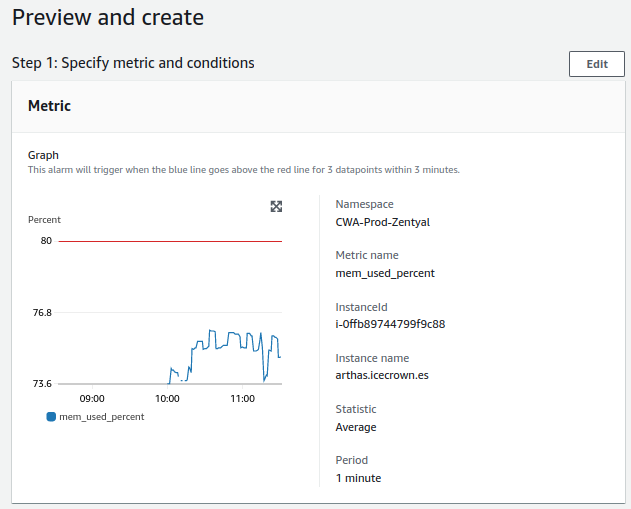
The last thing we will do on the monitoring system is to create alerts. All alerts we configure will be made from CloudWatch -> All alarm and will be as follows:
- CPU:
- Check will be done every minute.
- The alert value to trigger will be greater than 80%.
- For a notification to be sent, the alert must occur 3 times in a row.
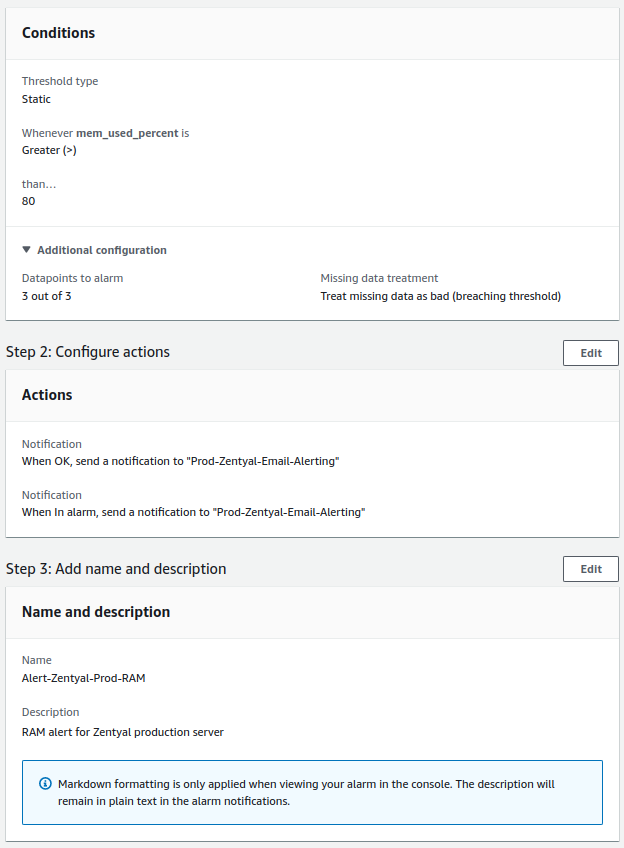
- RAM:
- Check will be done every minute.
- The alert value to trigger will be greater than 80%.
- For a notification to be sent, the alert must occur 3 times in a row.
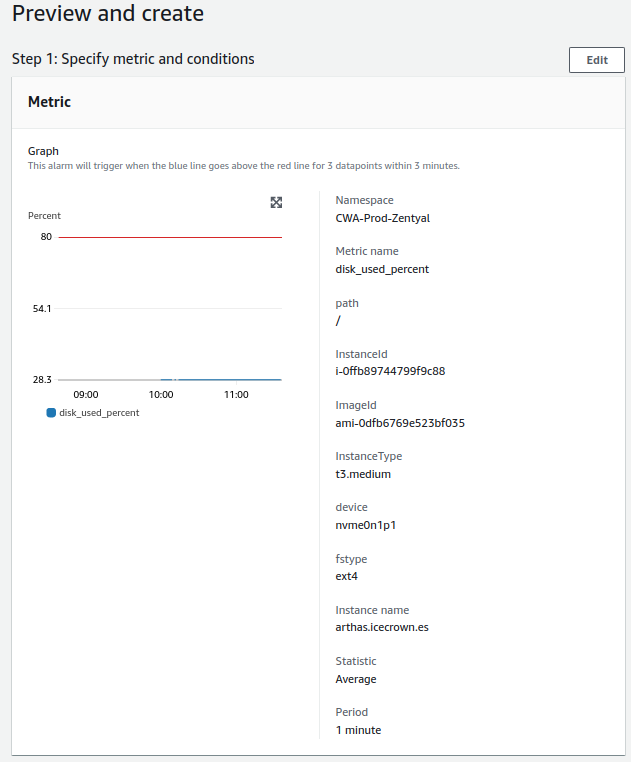
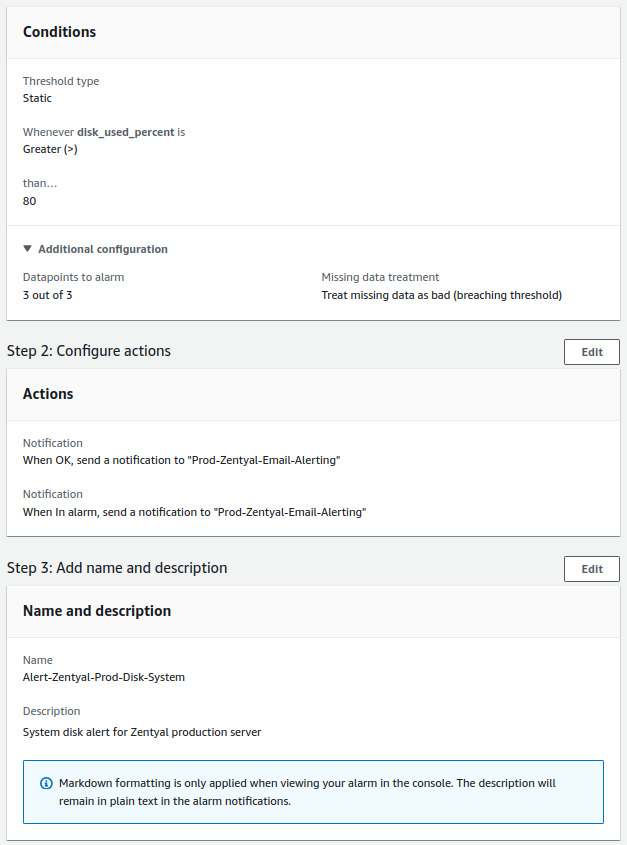
- System disk:
- Check will be done every minute.
- The alert value to trigger will be greater than 80%.
- For a notification to be sent, the alert must occur 3 times in a row.
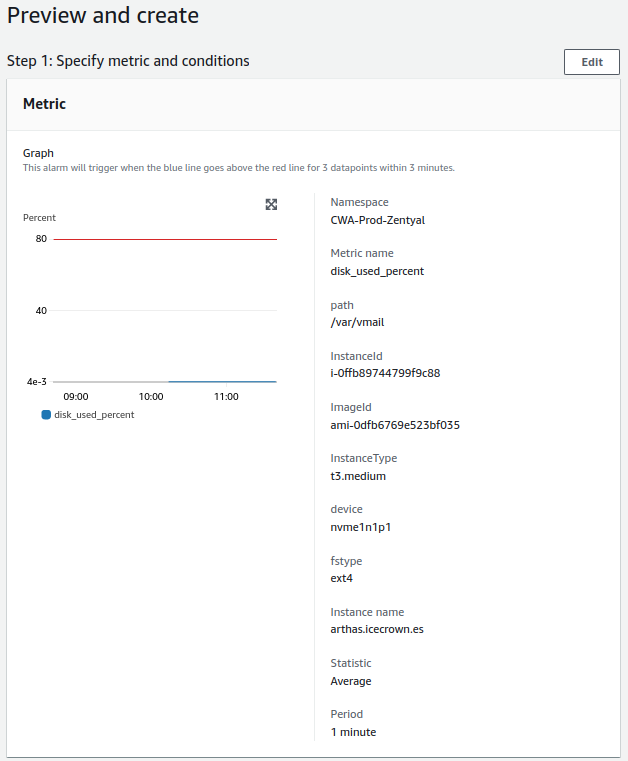
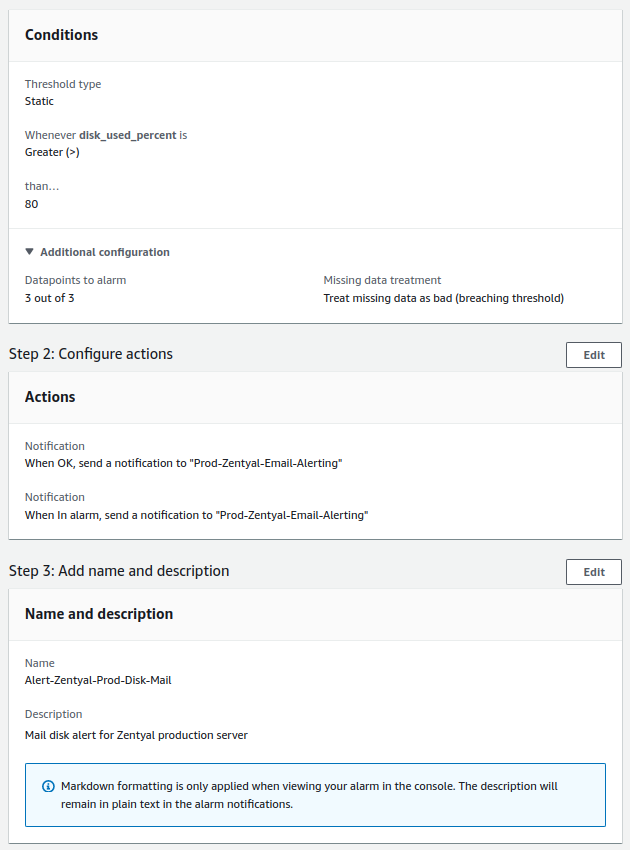
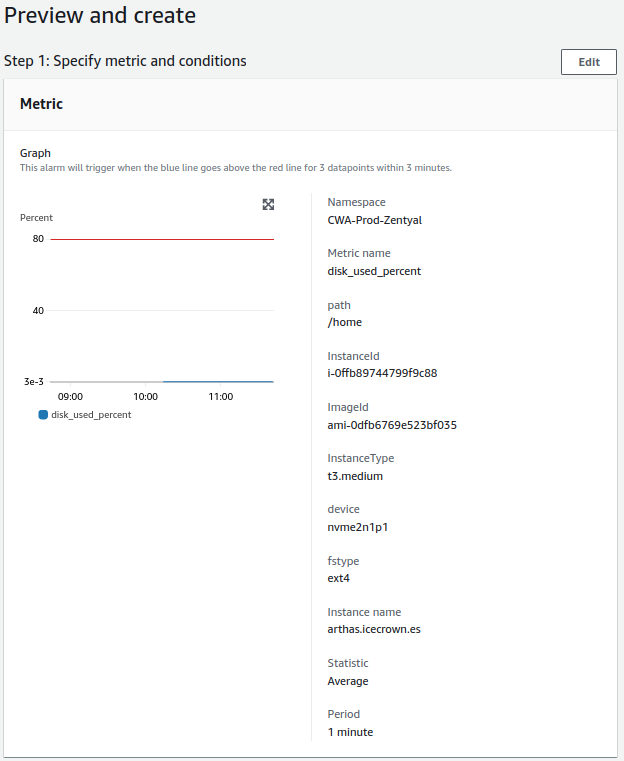
- Mail disk:
- Check will be done every minute.
- The alert value to trigger will be greater than 80%.
- For a notification to be sent, the alert must occur 3 times in a row.
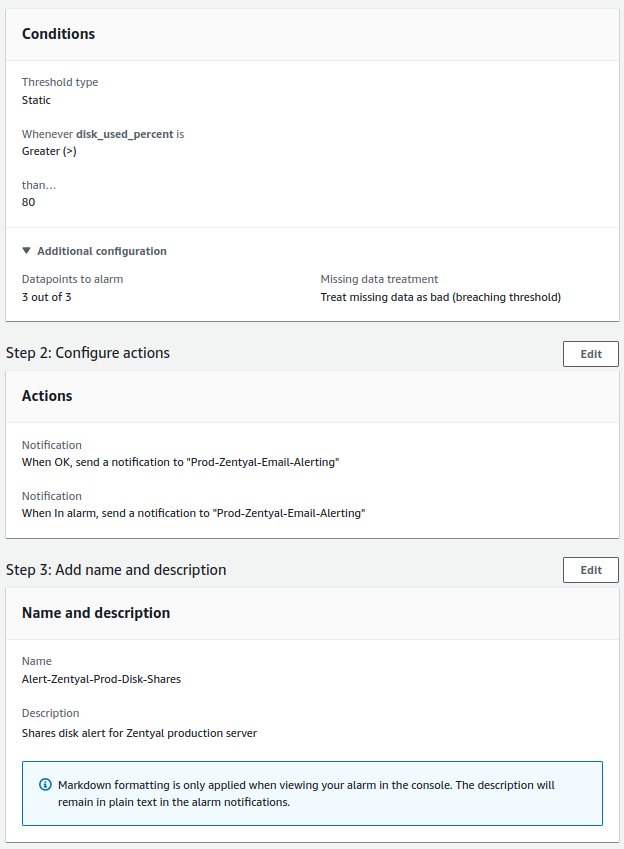
- Shared resources disk:
- Check will be done every minute.
- The alert value to trigger will be greater than 80%.
- For a notification to be sent, the alert must occur 3 times in a row.
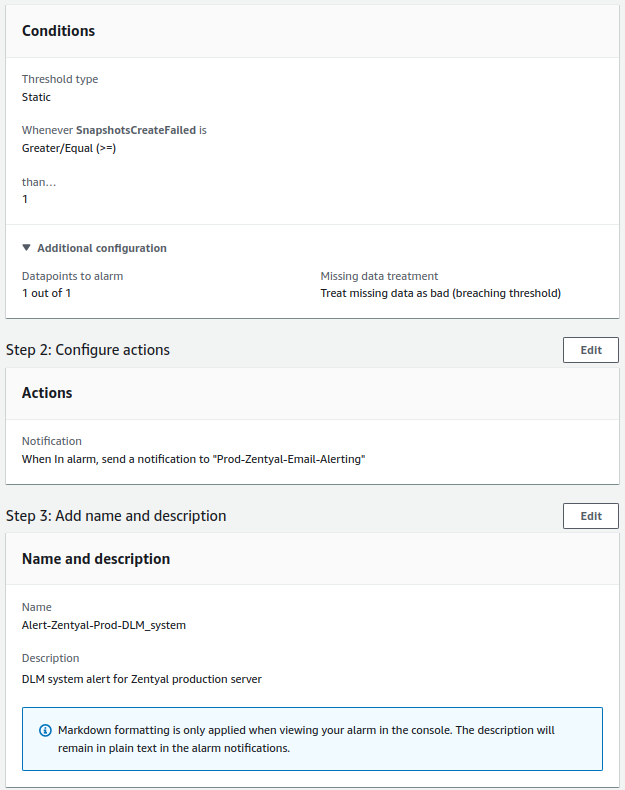
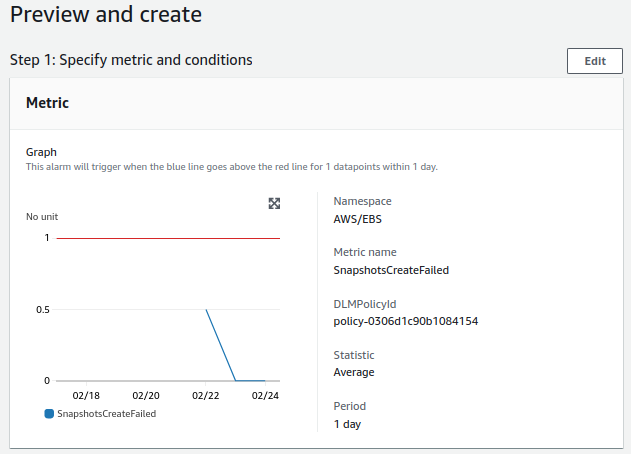
- DLM for system:
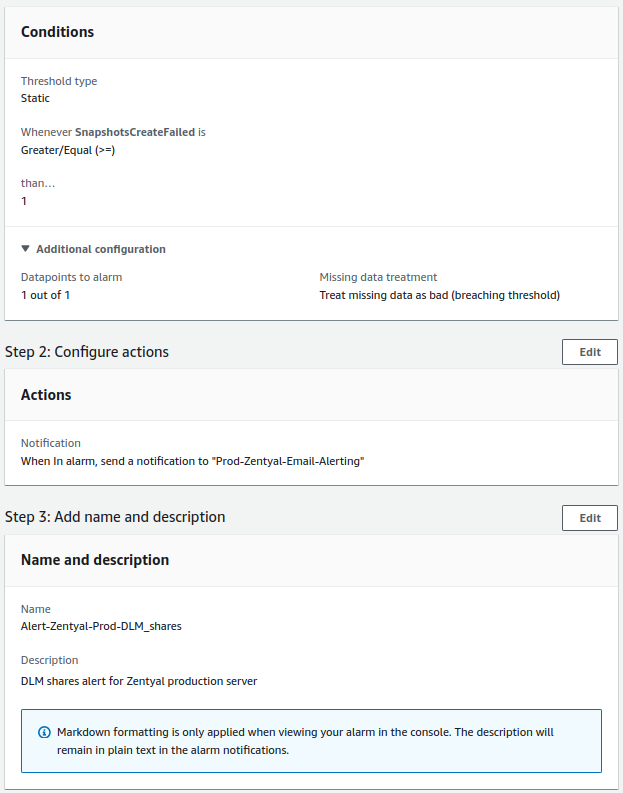
- Check will be done once a day.
- The alert value to trigger will be equal to or greater than 1.
- For a notification to be sent, the alert must occur once.
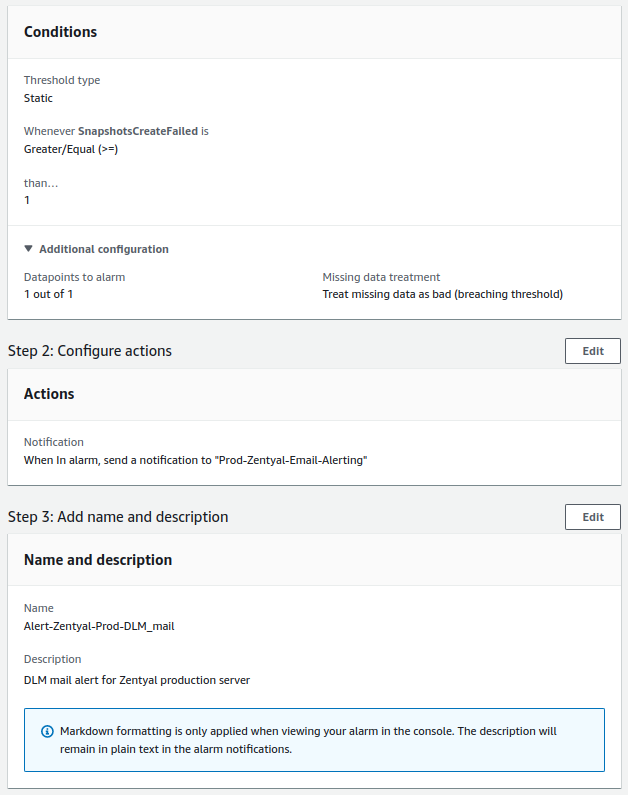
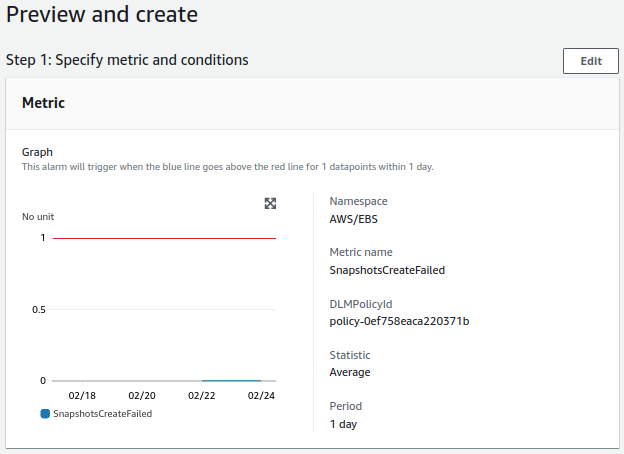
- DLM for mail:
- Check will be done once a day.
- The alert value to trigger will be equal to or greater than 1.
- For a notification to be sent, the alert must occur once.
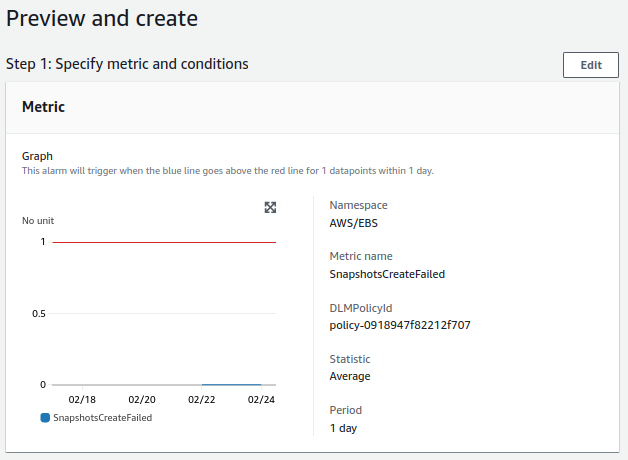
- DLM for shared resources:
- The check will be performed once a day.
- The alert value to trigger it will be equal to or greater than 1.
- For a notification to be sent, the alert must occur only once.
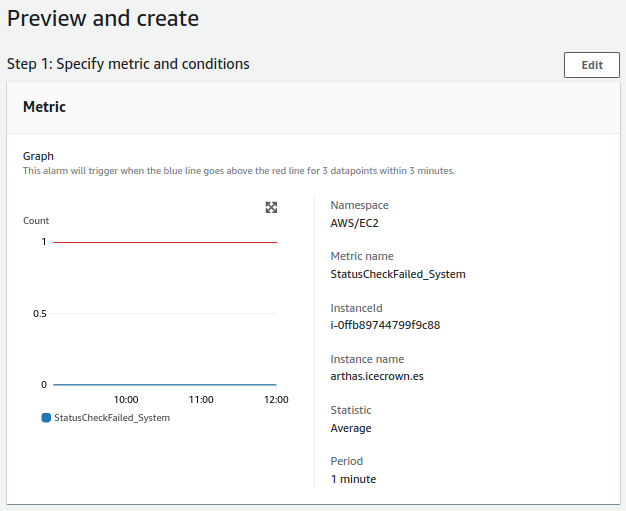
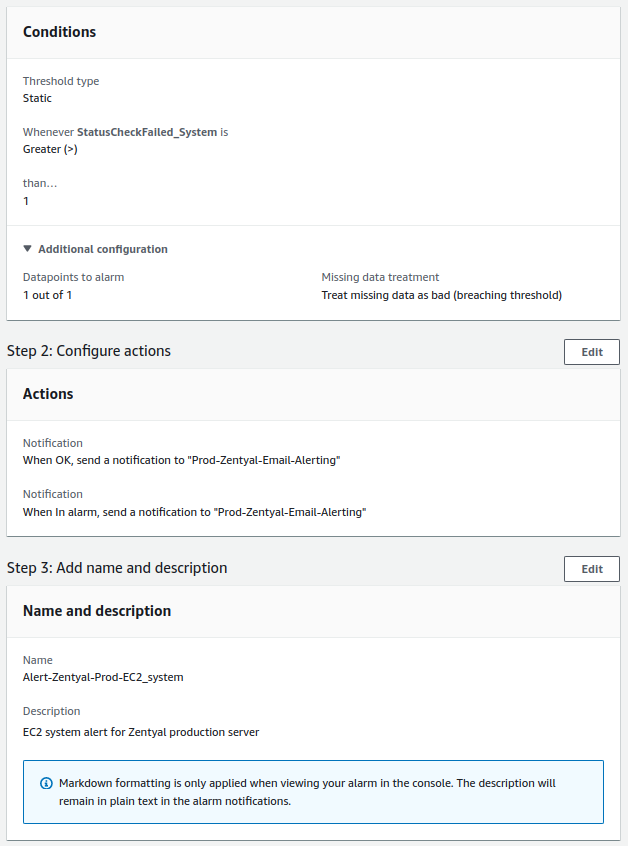
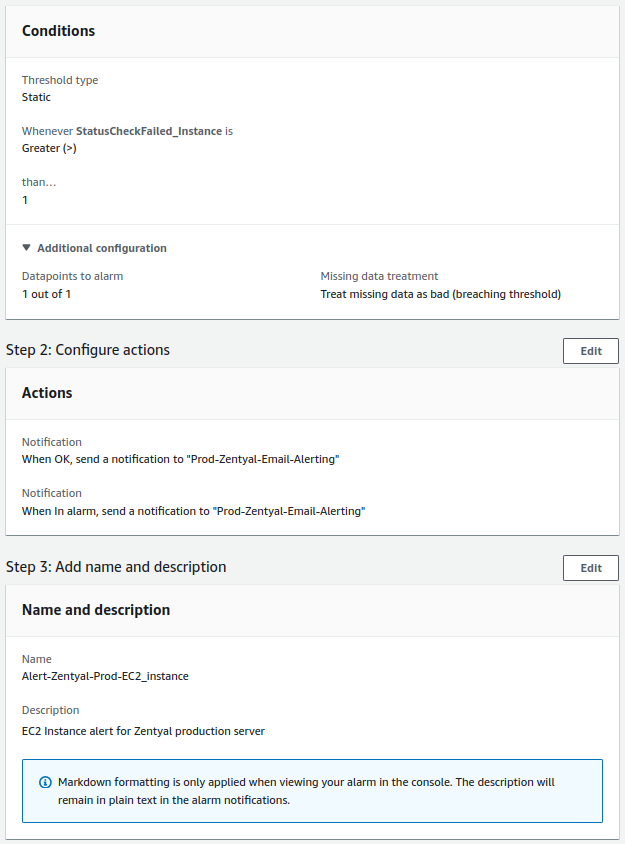
- EC2 failed checks:
- The check will be performed every minute.
- The alert value to trigger it will be greater than 80%.
- For a notification to be sent, the alert must occur 3 times consecutively.
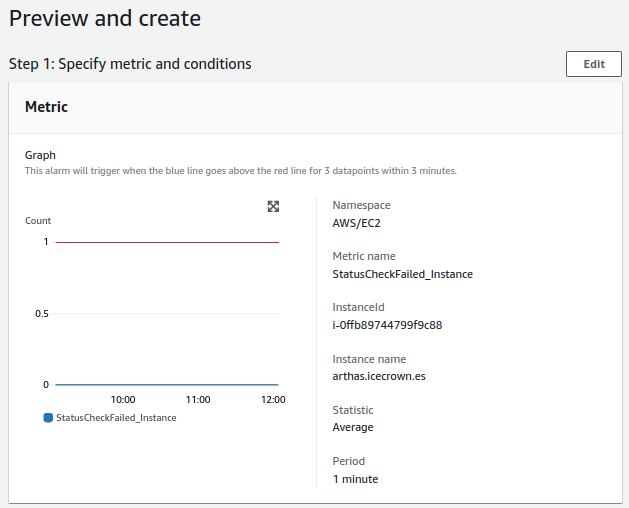
- Instance failed checks:
- The check will be performed every minute.
- The alert value to trigger it will be greater than 80%.
- For a notification to be sent, the alert must occur 3 times consecutively.
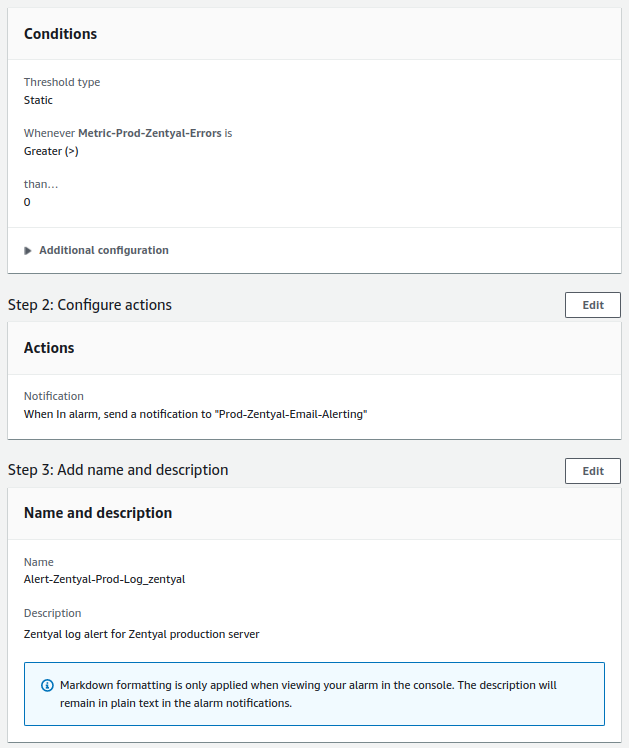
- Zentyal log errors:
- The check will be performed once a day.
- The alert value to trigger it will be equal to or greater than 1.
- For a notification to be sent, the alert must occur only once.
CPU
RAM
System Disk
Mail Disk
Shares Disk
DLM - System
DLM - Mail
DLM - Shares
EC2 - System
EC2 - Instance
Zentyal log
Created: April 12, 2023
